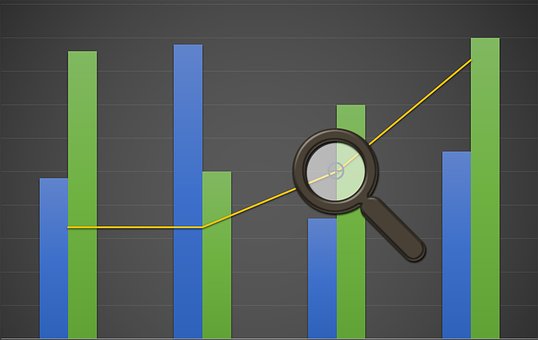

A new study suggests that the format in which graphs are presented may be biasing people into being too optimistic or pessimistic about the trends the graphs display.
Academics from City, University of London and University College London found that when people made predictions about how a trend would develop over...


